Understand Course Analytics
Analytics evaluate individual components of a course and evaluate student performance. Course Analytics takes a three pronged approach to creating substantive data for Canvas users.
-
Justification focuses on system reports and how the system is being used.
-
Intervention looks to predict at-risk students and how to meet their needs.
-
Learning focuses on learning outcomes, the effectiveness of the teaching style, and the division of time between students achieving competence and those falling behind.
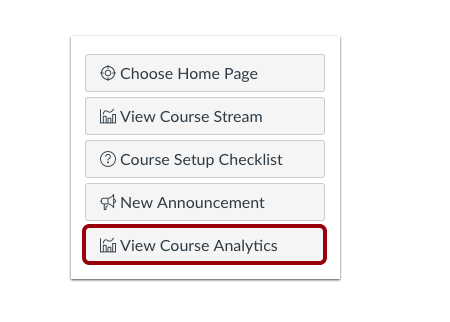
Course Analytics will show you activity, assignment submissions, grades, and students. To view your course analytics, go to the left-hand navigation menu in your Canvas course.

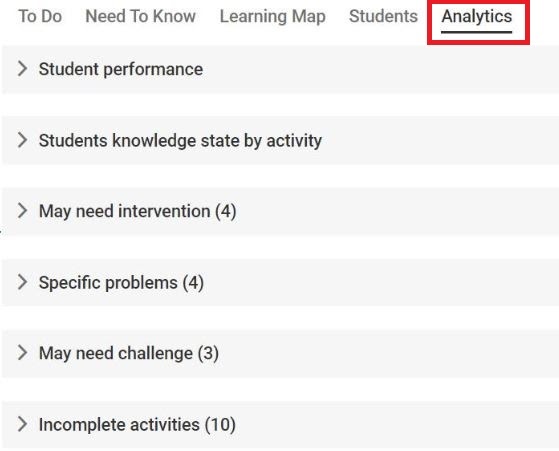
KnowledgePath, our adaptive platform, offers its own data analytics. Our adaptive platform also provides a great amount of data for instructors within the instructor interface. If you’d like to learn more information on the dashboard that is provided to you, please navigate to the Teaching in KnowledgePath page.
Analytics include four main areas: student activity, submissions, grades, and student analytics. They will show you how well your students are interacting with your course and help you evaluate performance. Below is an example of the types of data provided in your course analytics.

Student Analytics show you how well a particular student is doing in your course. You can access Student Analytics through the Course Home Page or the People page.
Student Analytics include four main areas:
-
View activity for the student.
-
View responsiveness of messaging (communication) from the student to instructor and instructor to student.
-
View assignment submissions to see if the student is at-risk or not.
-
View the student’s grades.
