Descriptive Research
Introduction
Psychologists agree that if their ideas and theories about human behavior are to be taken seriously, they must be backed up by data. However, the research of different psychologists is designed with different goals in mind, and the different goals require different approaches. These varying approaches are known as research designs. A research design is the specific method a researcher uses to collect, analyze, and interpret data. Psychologists use three major types of research designs, and each provides an essential avenue for scientific investigation. Descriptive research is research designed to provide a snapshot of the current state of affairs. Correlational research is research designed to discover relationships among variables and to allow the prediction of future events from present knowledge. Experimental research is research in which initial equivalence among research participants in more than one group is created, followed by a manipulation of a given experience for these groups and a measurement of the influence of the manipulation. Each of the three research designs has its own unique strengths and weaknesses.
Stangor, C. (2017). Introduction to psychology. Boston, MA: Flatworld.
Descriptive Research
Descriptive research is designed to create a snapshot of the current thoughts, feelings, or behavior of individuals. Sometimes the data in a descriptive research project are based on only a small set of individuals, often only one person or a single small group. These research designs are known as case studies—descriptive records of one or more individual’s experiences and behavior. Sometimes case studies involve ordinary individuals, as when developmental psychologist Jean Piaget used his observation of his own children to develop his stage theory of cognitive development. More frequently, case studies are conducted on individuals who have unusual or abnormal experiences or characteristics or who find themselves in particularly difficult or stressful situations. The assumption is that by carefully studying individuals who are socially marginal, who are experiencing unusual situations, or who are going through a difficult phase in their lives, we can learn something about human nature more broadly.
Sigmund Freud was a master of using the psychological difficulties of individuals to draw conclusions about basic psychological processes. Freud wrote case studies of some of his most interesting patients and used these careful examinations to develop his important theories of personality. One classic example is Freud’s description of “Little Hans,” a child whose fear of horses was interpreted by the psychoanalyst as repressed sexual impulses and the Oedipus complex (Freud (1909/1964).
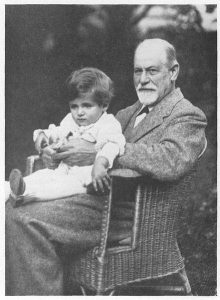
Retrieved from https://www.freud.org.uk/photo-library/detail/21345/. Licensed under CC-BY-SA.
Another well-known case study is Phineas Gage, a man whose thoughts and emotions were extensively studied by cognitive psychologists after a railroad spike was blasted through his skull in an accident. Although there have been questions about the interpretation of this case study (Kotowicz, 2007), it did provide early evidence that the brain’s frontal lobe is involved in emotion and morality (Damasio et al., 2005). An interesting example of a case study in clinical psychology is described by Rokeach (1964), who investigated in detail the beliefs and interactions among three patients with schizophrenia, all of whom were convinced they were Jesus Christ.

“Phineas Gage.” Retrieved from https://en.wikipedia.org/wiki/Phineas_Gage#/media/File:Phineas_Gage_Cased_Daguerreotype_WilgusPhoto2008-12-19_EnhancedRetouched_Color.jpg. Licensed under CC-BY-SA.3.0.
In other cases, the data from descriptive research projects come in the form of a survey—a measure administered through either an interview or a written questionnaire to get a picture of the beliefs or behaviors of a sample of people of interest. The people chosen to participate in the research (known as the sample) are selected to be representative of all the people that the researcher wishes to know about (the population). In election polls, for instance, a sample may be taken from the population of all “likely voters” in the upcoming elections.
The results of surveys may sometimes be rather mundane, such as “Nine out of ten doctors prefer Tymenocin,” or “The median income in Montgomery County is $36,712.” Yet other times (particularly in discussions of social behavior), the results can be shocking: “More than 40,000 people are killed by gunfire in the United States every year,” or “More than 60% of women between the ages of 50 and 60 suffer from depression.” Descriptive research is frequently used by psychologists to get an estimate of the prevalence (or incidence) of psychological disorders.
A final type of descriptive research—known as naturalistic observation—is research based on the observation of everyday events. For instance, a developmental psychologist who watches children on a playground and describes what they say to each other while they play is conducting descriptive research, as is a biopsychologist who observes animals in their natural habitats.
In some cases, naturalistic observation involves the recording and analysis of the behaviors of thousands of people doing the things they do every day, such as posting on Twitter.

“Birdwatching on the Beach.” Retrieved from https://en.wikipedia.org/wiki/Wildlife_observation#/media/File:Birdwatching_on_beach.jpg. Licensed under PDM.
Damasio, H., Grabowski, T., Frank, R., Galaburda, A. M., Damasio, A. R., Cacioppo, J. T., & Berntson, G. G. (2005). The return of Phineas Gage: Clues about the brain from the skull of a famous patient. In Social neuroscience: Key readings. (pp. 21–28). New York, NY: Psychology Press.
Kotowicz, Z. (2007). The strange case of Phineas Gage. History of the Human Sciences, 20(1), 115–131.
Rokeach, M. (1964). The three Christs of Ypsilanti: A psychological study. New York, NY: Knopf.
Stangor, C. (2017). Introduction to psychology. Boston, MA: Flatworld.
Analysis of Descriptive Data
The results of descriptive research projects are analyzed using descriptive statistics—numbers that summarize the distribution of scores on a measured variable. Most variables have distributions where the scores are located near the center of the distribution, and the distribution is symmetrical and bell-shaped. A data distribution that is shaped like a bell is known as a normal distribution.
A distribution can be described in terms of its central tendency—that is, the point in the distribution around which the data are centered—and its dispersion, or spread. The arithmetic average, or arithmetic mean, is the most commonly used measure of central tendency. It is computed by calculating the sum of all the scores of the variable and dividing this sum by the number of participants in the distribution (denoted by the letter N). The sample mean is usually indicated by the letter M.
In some cases, however, the data distribution is not symmetrical. This occurs when there are one or more extreme scores (known as outliers) at one end of the distribution. Consider, for instance, the variable of family income, which includes an outlier (a value of $3,800,000). In this case, the mean is not a good measure of central tendency. Although it appears that the central tendency of the family income variable should be around $70,000, the mean family income is actually $223,960. The single extreme income ($3,800,000) has a disproportionate impact on the mean, resulting in a value that does not well represent the central tendency.
The median is used as an alternative measure of central tendency when distributions are not symmetrical. The median is the score in the center of the distribution, meaning that 50% of the scores are greater than the median and 50% of the scores are less than the median
A final measure of central tendency, known as the mode, represents the value that occurs most frequently in the distribution.
In addition to summarizing the central tendency of a distribution, descriptive statistics convey information about how the scores of the variable are spread around the central tendency. Dispersion refers to the extent to which the scores are all tightly clustered around the central tendency.
One simple measure of dispersion is to find the largest (the maximum) and the smallest (the minimum) observed values of the variable and to compute the range of the variable as the maximum observed score minus the minimum observed score. The standard deviation, symbolized as s, is the most commonly used measure of dispersion. Distributions with a larger standard deviation have more spread.
Advantages and Disadvantages of Descriptive Research
An advantage of descriptive research is that it attempts to capture the complexity of everyday behavior. Case studies provide detailed information about a single person or a small group of people, surveys capture the thoughts or reported behaviors of a large population of people, and naturalistic observation objectively records the behavior of people or animals as it occurs naturally. Thus descriptive research is used to provide a relatively complete understanding of what is currently happening.
Despite these advantages, descriptive research has a distinct disadvantage in that, although it allows us to get an idea of what is currently happening, it is usually limited to static pictures. Although descriptions of particular experiences may be interesting, they are not always transferable to other individuals in other situations, nor do they tell us exactly why specific behaviors or events occurred. Detailed descriptions of individuals who have suffered a stressful event, such as a war or an earthquake, can be used to understand how those particular individuals reacted to the particular event. But observing these reactions may not tell us much about the effects of stress on other people or other types of stress. Because there is no comparison group that did not experience the stressful situation, we cannot know what these individuals would be like if they hadn’t had the stressful experience.
Stangor, C. (2017). Introduction to psychology. Boston, MA: Flatworld.
Descriptive Research-Video
Jennifer Klingeman. (2016, September 16). Descriptive research. [Video File]. Retrieved from https://youtu.be/rKb5H3X3OSE. Standard YouTube License.
Tutor2u. (2016, April 16). Research methods-Measures of central tendency. [Video File]. Retrieved from https://youtu.be/ZVxZBK9Vm5w. Standard YouTube License.
Tutor2u. (2016, April 25). Research methods: Measures of dispersion (Standard deviation & range). [Video File]. Retrieved from https://youtu.be/oNYON5IBD9w. Standard YouTube License.
Summary
Descriptive research is designed to provide a snapshot of the current state of affairs and it allows the development of questions for further study. It does not; however, assess relationships among variables. The three primary research designs used in descriptive research are surveys, cases studies and naturalistic observations. Each of these research designs have unique strengths and weaknesses.
The results of descriptive research projects are analyzed using descriptive statistics. Measures of central tendency are used to determine the central value in a distribution. The mean, also considered the arithmetic mean, is the average of all of the data scores. The median is the score located in the middle when all of the data scores are arranged in numerical order. The mode is the data score that occurs the most frequently. These measurements help describe the data and explain where the numbers fall without having to analyze the entire data set. The dispersion, or spread, of the data is measured using either the standard deviation or the range. This explains how close or spread out the data scores are in relation to the central tendency.
Stangor, C. (2017). Introduction to psychology. Boston, MA: Flatworld.