Infographics
Introduction
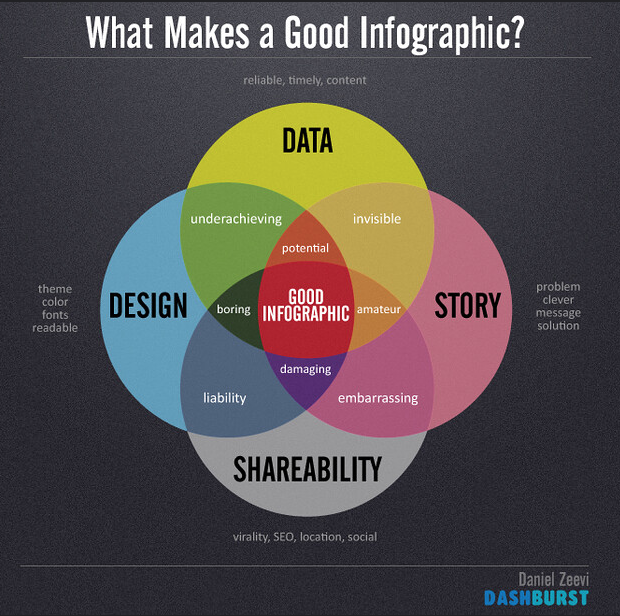
An infographic is a visual way to represent data and is usually presented in a poster format. It’s a nice way to present sometimes complex information in an interesting way that is easy to digest.
When planning to create an infographic, you should consider the following:
- What are your major points
- What visual elements you want to include
- How to make your key points and visual elements stand out
Infographics
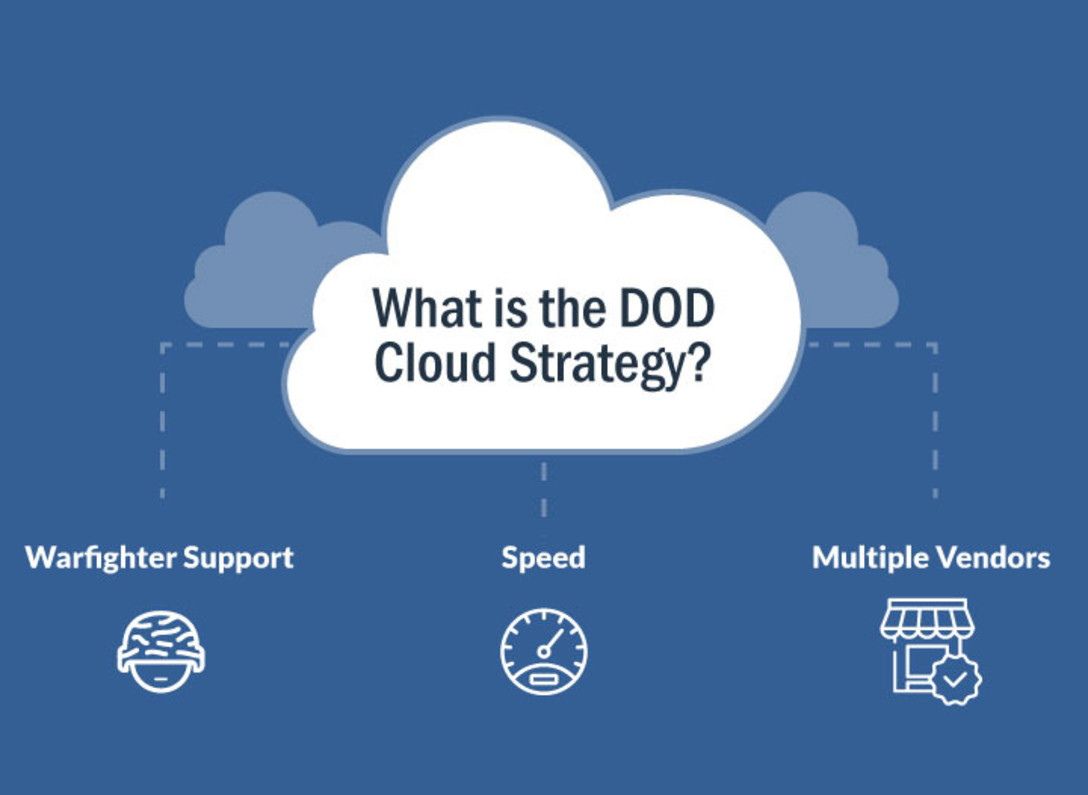
As displayed in the image below, infographics can take rather complex ideas and break them into more visually appealing (and easier to digest) graphics. This particular infographic walks through a process from beginning to end. You might notice the images mirror the stage in the process and give a quick visual of what each scenario might look like in practice.
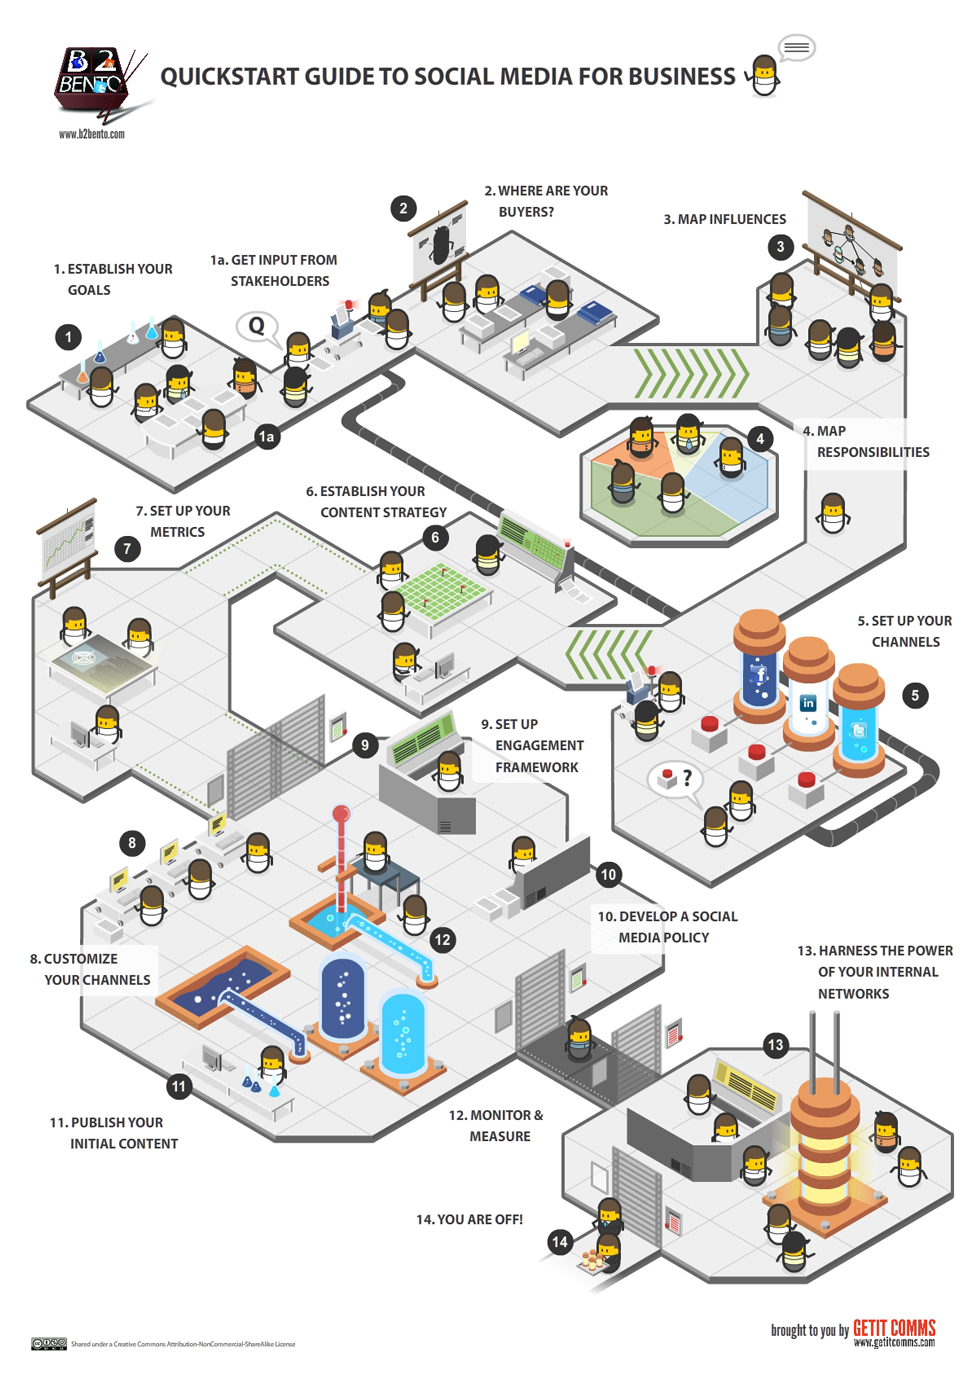
This infographic is likely pulled from a larger process report with a great amount of detail. For example, the full steps below might serve as a supplement or handout to parallel the visual process.
1. ESTABLISH YOUR GOALS
- Ask why you need to be in social media.
- Formulate your social media goals and objectives.
- Align with the business goals of your company.
1a. GET INPUT FROM STAKEHOLDERS
- Conduct interviews and internal surveys to find out what social media channels would best serve your company and your goals.
2. WHERE ARE YOUR BUYERS?
- Map your buyers’ personae.
- Find channels where your team’s and buyers’ interactions intersect.
- Determine which social media channels will work best in reaching out to them.
3. MAP INFLUENCES
- Use monitoring tools to find out more about your prospects.
- Discover the “influencers” of buyers’ purchase decisions – bloggers, partners, and even competitors.
4. MAP RESPONSIBILITIES
- Distribute key roles among stakeholders.
- Set up a social media “task force” around key responsibilities
5. SET UP YOUR CHANNELS
- Use the internal survey results and buyers’ personae to determine which channels you will engage in, e.g., Facebook, Twitter, LinkedIn
6. ESTABLISH YOUR CONTENT STRATEGY
- Source for existing content and repurpose it, e.g., whitepapers, case studies, opinion pieces, videos, etc.
- Identify topics that align with key marketing focus areas.
- Research to determine relevancy by searching for brand name, competitors, and target keywords
7. ESTABLISH YOUR METRICS
- Create and align metrics and monitoring framework with strategic objectives.
- Some key measurement goals include Reach, Buzz, Sentiment, Influence.
- Measure only what matters to the business.
8. CUSTOMIZE YOUR CHANNELS
- Set up, customize and optimize your channels, e.g., multi-author blogging platform, customized FB page, YouTube channel, etc.
9. SET UP ENGAGEMENT FRAMEWORK
- Work out who responds, how, where (what channel), and how often.
- Constancy and immediacy are keys to well-managed social media engagement.
10. DEVELOP A SOCIAL MEDIA POLICY
- Based on best practices, what’s acceptable, out-of-bounds markers, confidential information, business vs. personal capacity, etc.
- Document everything to avoid grey areas that may hinder engagement.
11. PUBLISH YOUR INITIAL CONTENT
- Develop an editorial schedule.
- Populate your channels with appropriate content.
- Establish content syndication mechanisms across social media channels.
12. MONITOR & MEASURE
- Set up monitoring and measurement tools based on the metrics established earlier.
13. HARNESS THE POWER OF YOUR INTERNAL NETWORKS
- Time to get your team to provide the initial ballast.
- Propagate, publicize, promote.
14. YOU ARE OFF!
- Analyze, Adapt and Improve: Adapt any new findings into current processes, and improve efforts as you navigate through this social media journey.
- Remember – this is an iterative process.
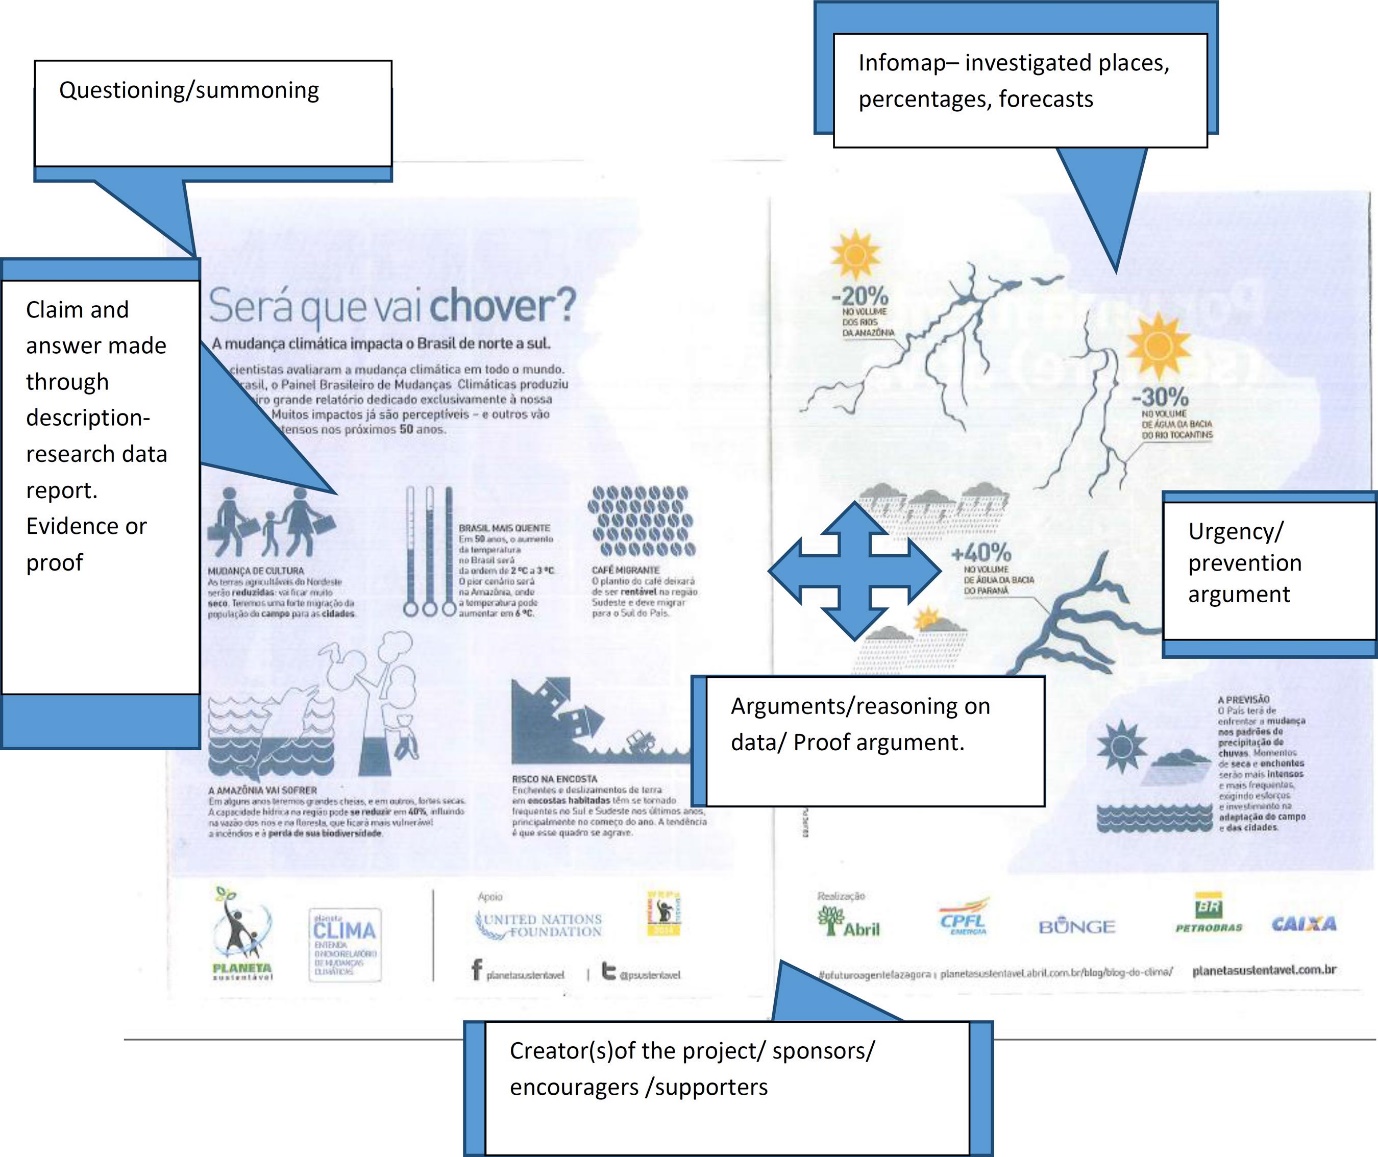
Other forms of infographics include
- infomaps (visually representing statistics across geographic locations),
- research projects (normally inclusive of research findings), and
- marketing materials (with the aim of captivating an audience for sales purposes).
Infomap example:
Research project example:
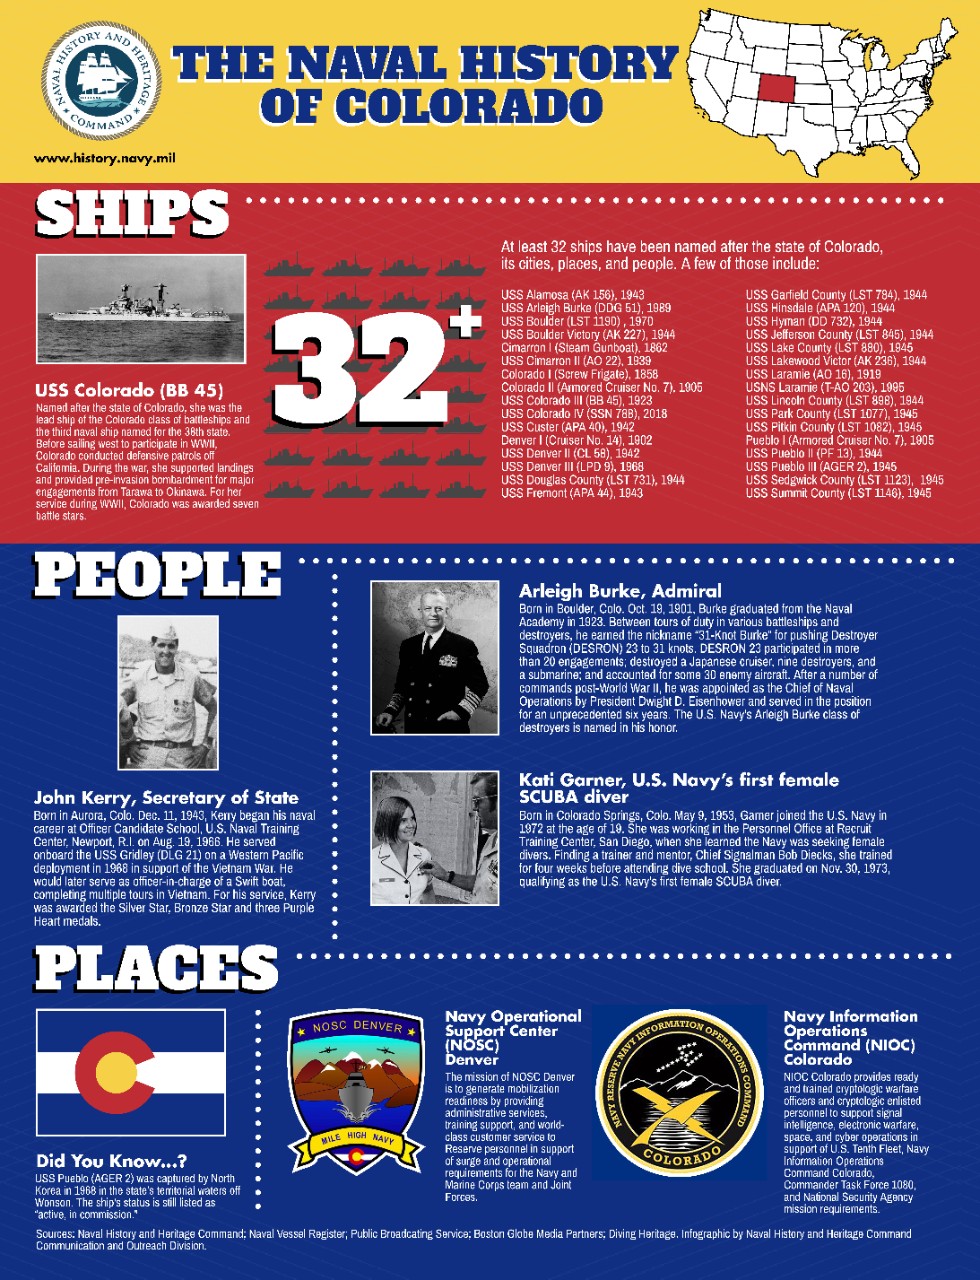
Marketing example:
Steps in Creating an Infographic
An infographic is a brief informational graphic tool (usually 1 page or computer screen shot). According to the venngage blog introduction to infographics:
They are often used to visualize data, step-by-step processes, timelines, research findings, organizational hierarchies, and many other types of information (https://venngage.com/blog/create-infographics).
Infographics tend to be more engaging to audiences than lengthy text—like reading a book with pictures often is more interesting than reading a book with only words. Imagine reading Hawthorne’s The Scarlet Letter as a high school student with pictures to make the characters and their situations come alive for you, compared to reading the text alone. This helps explain the popularity of graphic novels.
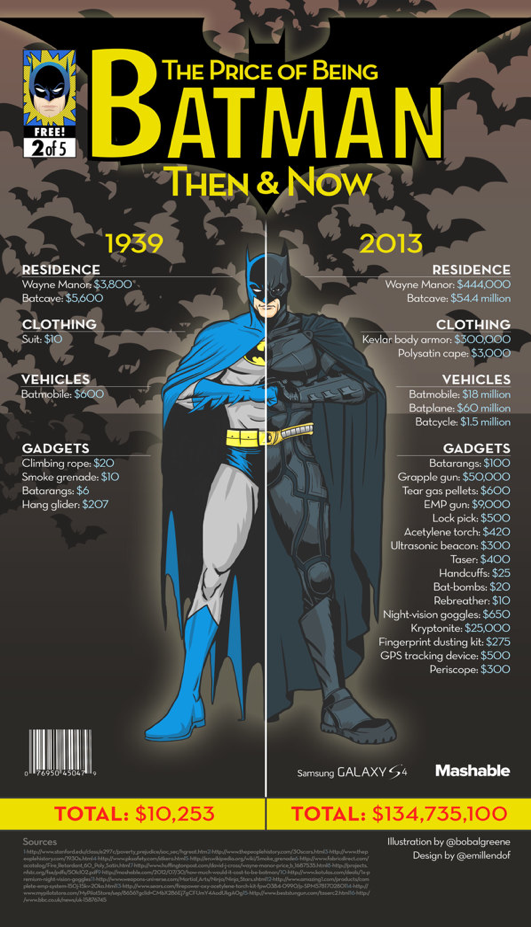
Infographics tap into a fact long recognized in psychology: images are more easily interpreted and recalled than the written word (Paivio, 1971). For example, thenextweb blog presented the example below where you can quickly see how costs (of being a superhero) exploded between 1939 and 2013. Imagine if you had to read through this information in text form?
The Price of Being Batman Then & Now Infographic Example
The following presents 4 steps in creating an infographic for communicating with your audiences.
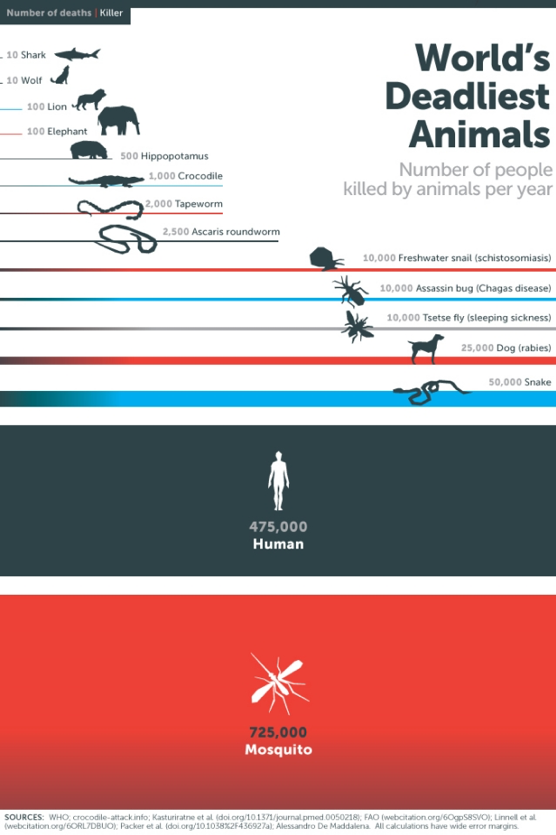
Step 1. Translate your topic into a burning question that interests your audience. As an example, venngage blog (https://venngage.com/blog/create-infographics) highlights the use of an infographic by the Bill and Melinda Gates Foundation to generate interest in a topic of little interest to many people in Northern climates: malaria. They framed it in terms of the world’s deadliest animals—if you are a fan of “shark week,” have a fear of crocodiles, snakes, spiders, or creatures, or are concerned about interpersonal violence rates, this infographic might peak your interest.
Worlds Deadliest Animals Infographic
Step 2. Gather the information to be presented in the infographic. Most likely, you will collect more information than is needed. You will need to be selective and/or creative in how you combine different pieces of information. However, it is also critically important that you maintain truthfulness in your selection and presentation of information. You also need to cite your sources!
Step 3. Design the infographic. One feature to keep in mind as you design an infographic is the medium through which it will be distributed. If it will be presented in print, you may have the luxury of using both sides of a page; if a poster or electronic “screen” is the medium, you are limited to one side/one page. Various software packages are available, many for free, to help in the design process (e.g., Canva Infographic Maker; Easel.ly; Piktochart; Snappa; Venngage; Visme; Visualize). Most of these are free to use in their “base” form; advanced options are available with a fee. Another option is to design the tool “from scratch” using either Word® or PowerPoint® with or without design templates. Remember to be concise, precise, and accurate in what you write. Consider image and graph/chart tools previously discussed, as well.
Step 4. Produce the infographic in your selected medium (print, electronically, or both) and disseminate your information to your audience.
Stop and Think
Spend some time in a “scavenger hunt” viewing and critiquing infographics that others have developed. Consider what seems to work and what does not for the different examples you locate. Use your observations to generate a set of guidelines for developing your own infographics (e.g., layout, color, design, content, writing style).
Summary
Infographics are now seen as powerful communication tools. They engage with a variety of audiences and present information in a more digestible manner. Infographics can be used for multiple purposes in both academic and professional settings.
Sources:
“Category Archives: Infographic.” By The Visual Everything. Retrieved from: https://www.thevisualeverything.com/category/infographic/ Licensed under: CC-BY-SA
“What’s an infographic you ask?” By Sue Beckingham. Retrieved from: https://socialmediaforlearning.com/2013/03/12/whats-an-infographic-you-ask/ Licensed under: CC-BY Adapted by The American Women’s College
“Module 5 Chapter 4: Creating Infographics.” By Audrey Begun. Retrieved from: https://ohiostate.pressbooks.pub/swk3401/chapter/module-5-chapter-4-creating-infographics/ Licensed under: CC-BY-NC-ND
“Infographic: Quickstart Guide to Social Media for Business.” By B2B Technology Marketing Journal. Retrieved from: https://b2bento.com/infographic-quickstart-guide-to-social-media-for-business/ Licensed under: CC-BY-CA
“What Makes a Good Infographic?” By Daniel Zeevi. Retrieved from: https://www.flickr.com/photos/dashburst/8448339735 Licensed under: CC-BY-ND
“State Infographics.” By US Navy. Retrieved from: https://www.history.navy.mil/news-and-events/multimedia-gallery/infographics/state-infographics.html Licensed under: public domain.
